h<-read.csv("/home/peter/test/health2.csv")
str(h)
## 'data.frame': 165 obs. of 8 variables:
## $ year : int 2000 2001 2002 2003 2004 2005 2006 2007 2008 2009 ...
## $ country : Factor w/ 11 levels "Angola","Botswana",..: 1 1 1 1 1 1 1 1 1 1 ...
## $ life.expec : num 46.6 47.4 48.1 48.8 49.4 ...
## $ gdp.cap : num 606 574 776 850 1136 ...
## $ code : Factor w/ 11 levels "AGO","BWA","CMR",..: 1 1 1 1 1 1 1 1 1 1 ...
## $ Total.as.percGDP : num 2.79 5.38 3.63 4.41 4.71 4.1 4.54 3.38 3.84 4.37 ...
## $ govperc.total.exp : num 60.2 52.2 46.4 46.4 51.1 ...
## $ privat.perc.of.total: num 39.8 47.8 53.6 53.6 48.9 ...
library("latticeExtra", lib.loc="~/R/x86_64-pc-linux-gnu-library/3.0")
## Loading required package: lattice
## Loading required package: RColorBrewer
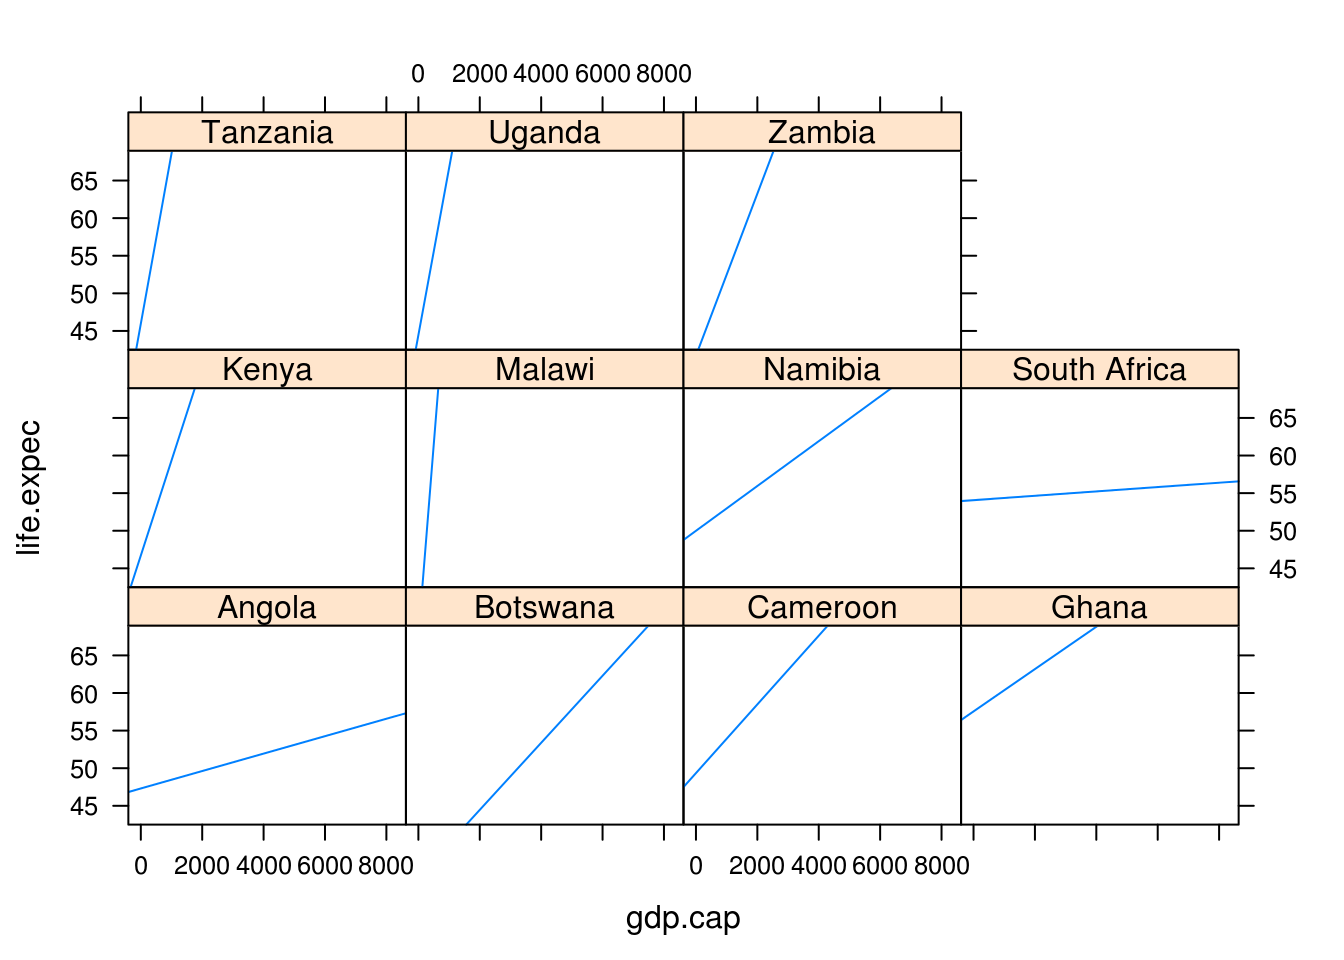
xyplot(life.expec ~ gdp.cap | factor(country), data = h, type = c("country", "r"))