Export code from esquisse for ggplot
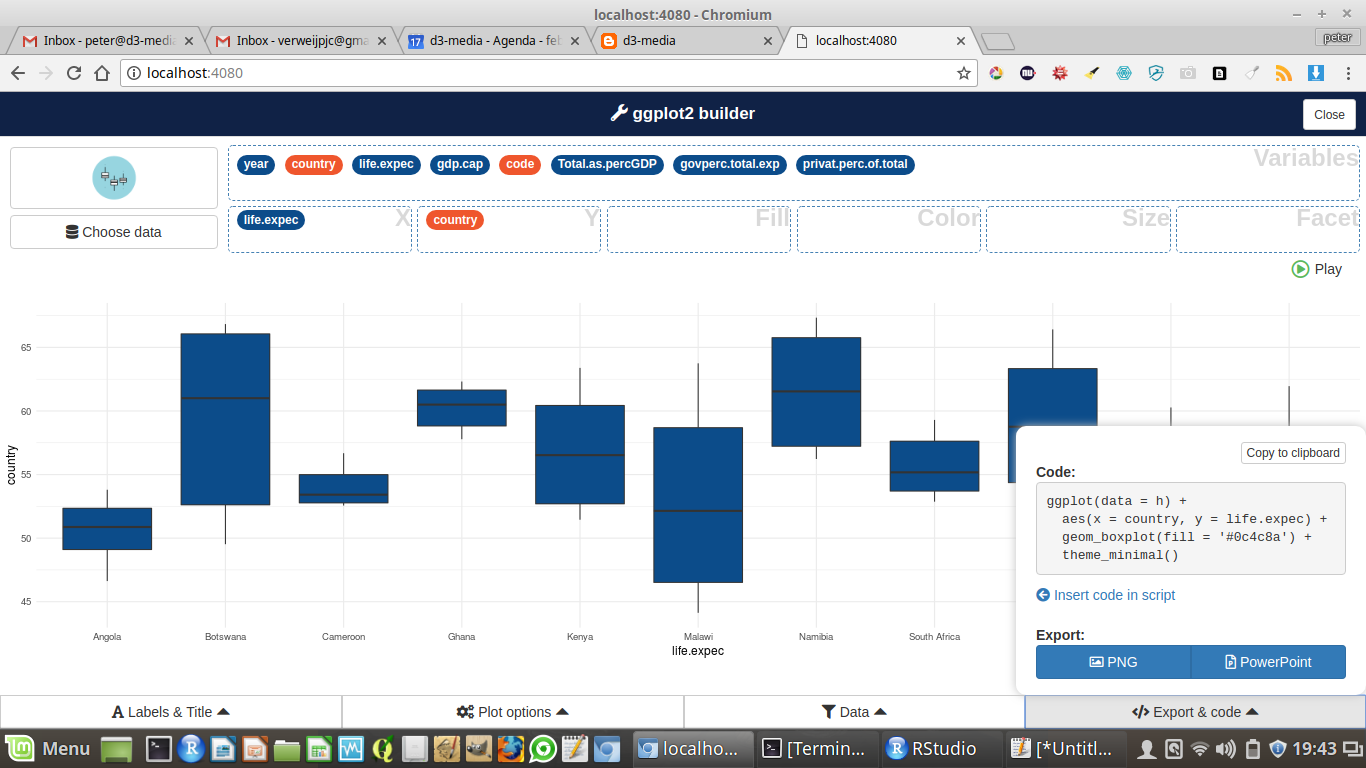
Esquisse is a new package that provides a GUI for ggplot. More on esquisse, see my blog The good thing about esquisse is the fine tuning, for example exporting the code.
Here follows an example.
Life expectancy for sub sahara countries
Let’s have a look at the data first
setwd("/home/peter/test")
health<-read.csv("health2.csv")
head(health)
## year country life.expec gdp.cap code Total.as.percGDP
## 1 2000 Angola 46.621 606.2723 AGO 2.79
## 2 2001 Angola 47.374 574.1942 AGO 5.38
## 3 2002 Angola 48.109 775.7655 AGO 3.63
## 4 2003 Angola 48.793 850.0757 AGO 4.41
## 5 2004 Angola 49.410 1135.6046 AGO 4.71
## 6 2005 Angola 49.954 1576.1628 AGO 4.10
## govperc.total.exp privat.perc.of.total
## 1 60.17 39.83
## 2 52.23 47.77
## 3 46.37 53.63
## 4 46.41 53.59
## 5 51.15 48.85
## 6 49.33 50.67
str(health)
## 'data.frame': 165 obs. of 8 variables:
## $ year : int 2000 2001 2002 2003 2004 2005 2006 2007 2008 2009 ...
## $ country : Factor w/ 11 levels "Angola","Botswana",..: 1 1 1 1 1 1 1 1 1 1 ...
## $ life.expec : num 46.6 47.4 48.1 48.8 49.4 ...
## $ gdp.cap : num 606 574 776 850 1136 ...
## $ code : Factor w/ 11 levels "AGO","BWA","CMR",..: 1 1 1 1 1 1 1 1 1 1 ...
## $ Total.as.percGDP : num 2.79 5.38 3.63 4.41 4.71 4.1 4.54 3.38 3.84 4.37 ...
## $ govperc.total.exp : num 60.2 52.2 46.4 46.4 51.1 ...
## $ privat.perc.of.total: num 39.8 47.8 53.6 53.6 48.9 ...
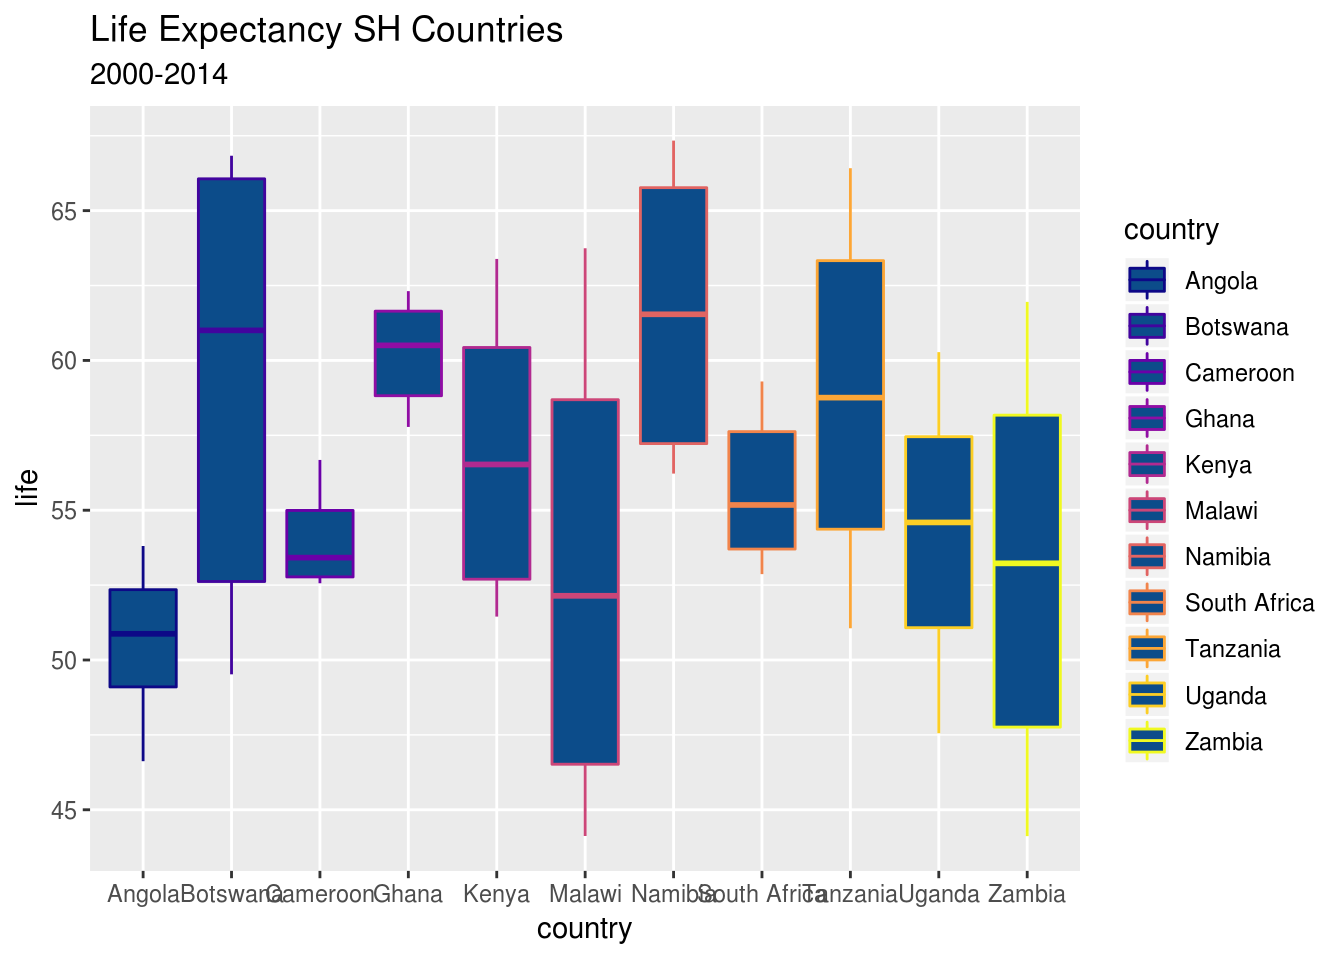
We are making a simple boxplot for life expectancies. Here is a picture.
Then we run the exported code for ggplot
library("ggplot2", lib.loc="~/R/x86_64-pc-linux-gnu-library/3.5")
ggplot(data = health) +
aes(x = country, y = life.expec, color = country) +
geom_boxplot(fill = '#0c4c8a') +
scale_colour_viridis_d(option = "plasma") +
labs(title = 'Life Expectancy SH Countries',
x = 'country',
y = 'life',
subtitle = '2000-2014')