library('dplyr')
##
## Attaching package: 'dplyr'
## The following objects are masked from 'package:stats':
##
## filter, lag
## The following objects are masked from 'package:base':
##
## intersect, setdiff, setequal, union
library('tidyr')
library('gapminder')
library('ggplot2')
library('ggalt')
library('forcats')
library('R.utils')
## Loading required package: R.oo
## Loading required package: R.methodsS3
## R.methodsS3 v1.7.1 (2016-02-15) successfully loaded. See ?R.methodsS3 for help.
## R.oo v1.22.0 (2018-04-21) successfully loaded. See ?R.oo for help.
##
## Attaching package: 'R.oo'
## The following objects are masked from 'package:methods':
##
## getClasses, getMethods
## The following objects are masked from 'package:base':
##
## attach, detach, gc, load, save
## R.utils v2.8.0 successfully loaded. See ?R.utils for help.
##
## Attaching package: 'R.utils'
## The following object is masked from 'package:tidyr':
##
## extract
## The following object is masked from 'package:utils':
##
## timestamp
## The following objects are masked from 'package:base':
##
## cat, commandArgs, getOption, inherits, isOpen, parse, warnings
library('png')
library('grid')
library('ggpubr')
## Loading required package: magrittr
##
## Attaching package: 'magrittr'
## The following object is masked from 'package:R.utils':
##
## extract
## The following object is masked from 'package:R.oo':
##
## equals
## The following object is masked from 'package:tidyr':
##
## extract
library('scales')
library('bbplot')
grouped_bar_df <- gapminder %>%
filter(year == 1967 | year == 2007) %>%
select(country, year, lifeExp) %>%
spread(year, lifeExp) %>%
mutate(gap = `2007` - `1967`) %>%
arrange(desc(gap)) %>%
head(5) %>%
gather(key = year,
value = lifeExp,
-country,
-gap)
#Make plot
grouped_bars <- ggplot(grouped_bar_df,
aes(x = country,
y = lifeExp,
fill = as.factor(year))) +
geom_bar(stat="identity", position="dodge") +
geom_hline(yintercept = 0, size = 1, colour="#333333") +
bbc_style() +
scale_fill_manual(values = c("#1380A1", "#FAAB18")) +
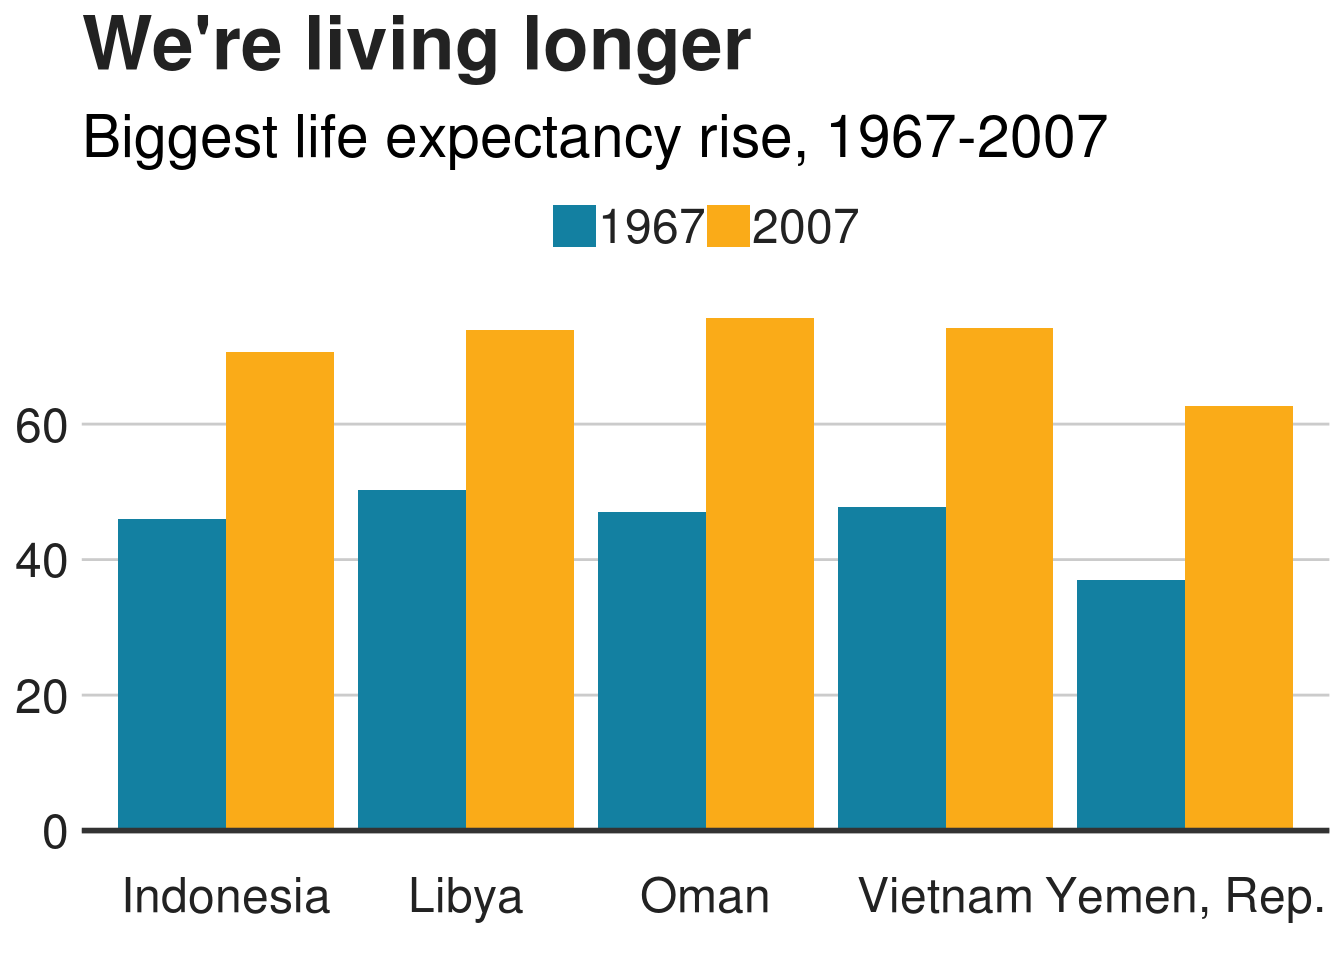
labs(title="We're living longer",
subtitle = "Biggest life expectancy rise, 1967-2007")
grouped_bars